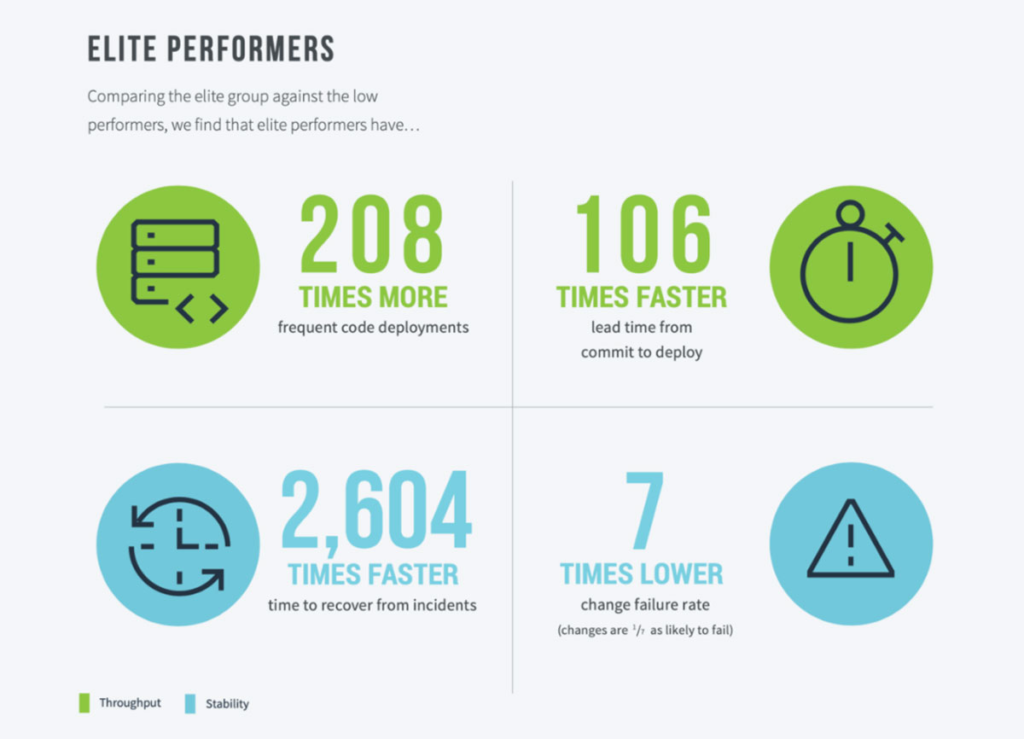
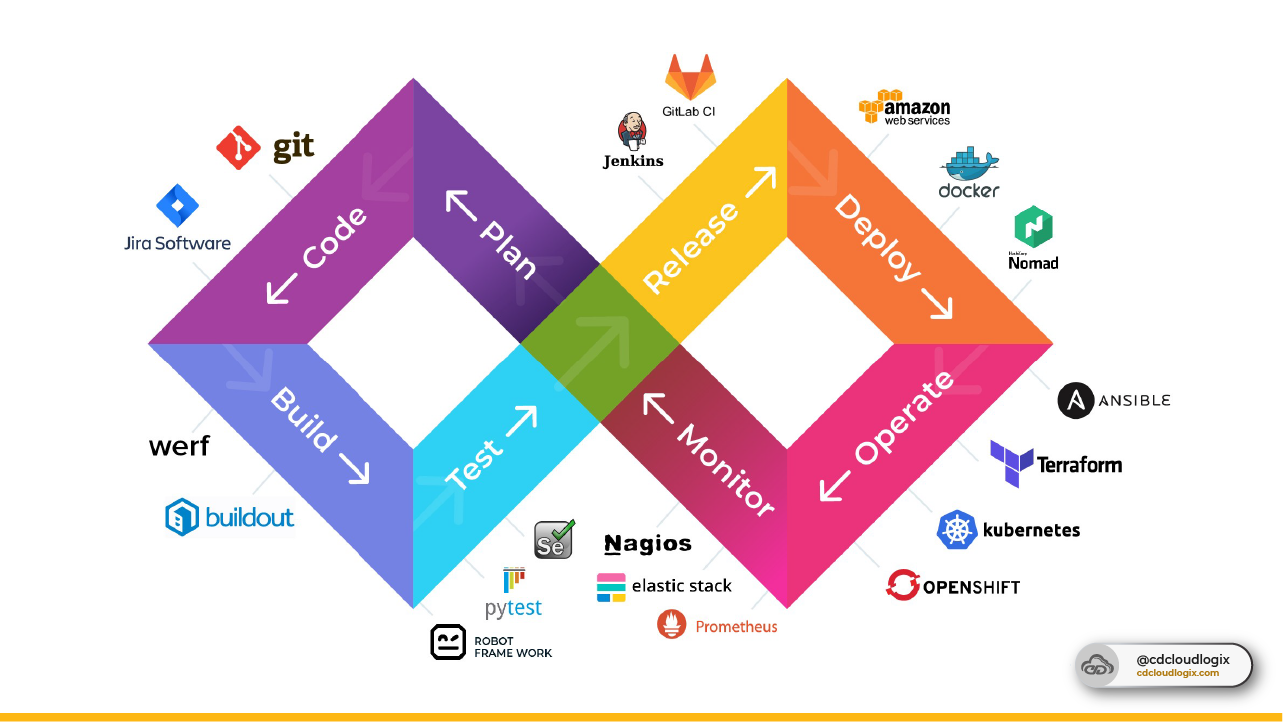
There are a few key DevOps metrics that can help you gauge whether or not your team is on track for success. The key to success in any business is always measuring and understanding your progress. In the world of DevOps, there are a few key metrics that can help you determine whether or not your team is on track.
1. Mean time to recover (MTTR)
2. Lead time for changes
3. Mean time between failures (MTBF)
4. Deployment frequency
5. Change failure rate
Each of these DevOps metrics provides valuable insight into the health and efficiency of your DevOps process. By monitoring these metrics, you can make adjustments as needed to ensure that your team is always moving forward.
Mean time to recover (MTTR)

Mean time to recover (MTTR): This DevOps metric measures the average time it takes to recover from a service outage. A shorter MTTR means that your team is able to quickly resolve issues and get your services up and running again.
In a nutshell, MTTR is the average time it takes to fix an issue. To calculate it, you divide the total downtime by the number of incidents.
For example, let’s say your website goes down for two hours and you have to restart the server three times. Your total downtime would be six hours and your MTTR would be two hours.
DevOps is all about reducing MTTR. By automating repetitive tasks and increasing communication between teams, DevOps teams can resolve issues faster and get back to developing new features. In addition, DevOps teams often use data analytics to identify issues before they cause problems. By monitoring trends and applying predictive analytics, DevOps teams can fix issues before they become critical. As a result, DevOps teams can reduce MTTR and increase efficiency.
Lead time for changes
Lead time for changes: This metric measures the amount of time it takes for a change to be made and deployed into production. A shorter lead time means that your team is able to quickly implement changes and deploy them into production.
If you’re working in devops, you know that things can change rapidly. Code needs to be pushed out quickly and efficiently, and there’s no room for error. However, this can often lead to a feeling of constantly being on the edge of your seat, waiting for the next change to come through.
While it’s important to be responsive to changes, it’s also important to have a lead time for changes in devops. This means having a process in place so that you can make sure that changes are made correctly and efficiently, without compromising quality. By having a lead time for changes in devops, you can help to ensure that your code is always up-to-date and ready for the next change.
Mean time between failures (MTBF)
Mean time between failures (MTBF): This DevOps metric measures the average amount of time between failures. A longer MTBF means that your team is able to keep your services up and running for longer periods of time.
MTBF is a DevOps metrics that tells us how long, on average, it takes for a system or component to fail. A high MTBF means that the system is reliable and doesn’t fail often. A low MTBF means that the system is less reliable and fails more often.
The MTBF can be affected by many factors, including the quality of the components, the environment in which the system is used, and the amount of use. Devops teams use MTBF to help identify areas where improvements can be made to reduce the number of failures. By improving the reliability of systems and components, devops teams can help reduce costly downtime and improve customer satisfaction.
Deployment frequency

Deployment frequency: This metric measures the number of times that your team deploys code into production. A higher deployment frequency means that your team is able to quickly and efficiently make changes and deploy them into production.
Deployment frequency is one of the key metrics in devops. The goal is to deploy code changes as frequently as possible, while still maintaining a high level of quality.
There are many benefits to high deployment frequency, including:
- faster feedback loops
- shorter lead times
- increased agility
However, it can also be challenging to achieve, due to the need for coordination between developers and operations teams. In order to achieve high deployment frequency, it is essential to have a well-defined devops process in place. By automating key tasks and working closely together, developers and operations teams can streamline the code deployment process and make it more efficient. As a result, high deployment frequency can be achieved, providing numerous benefits for the organization.
Change failure rate
Change failure rate: This DevOps metric measures the percentage of changes that fail when they are deployed into production. A lower change failure rate means that your team is able to successfully deploy changes into production more often.
The temptation for many IT organizations is to simply blame “the process” whenever a change fails. While it’s certainly true that inefficient and poorly executed processes can contribute to change failures, the reality is that most change failures are caused by one or more of the following factors:
- Lack of proper Change Management
- Lack of communication and collaboration
- Lack of adequate testing
- Lack of proper documentation.
Organizations need to accept responsibility for their own change failures and work to improve their overall change management processes. Only then will they be able to achieve the desired effect of reducing the change failure rate.
Conclusion

By monitoring these DevOps metric, you can gain a better understanding of your DevOps process and make DevOps is all about breaking down the barriers between different parts of an organization to improve communication and collaboration. By tracking these five key metrics, you can ensure that your team is headed in the right direction and meeting the goals you’ve set for them. Are there other DevOps metrics that are important to you?


